
Page 34 - DIY Investor Magazine | Issue 36
P. 34
Dec 2022 34
DIY Investor Magazine ·
Each generation seeks to learn from the mistakes of previous generations... by William Heathcoat-Amory
However, events rarely play out exactly as they have in the past. Whilst history doesn’t repeat, it does rhyme; the same might
be said of stock market cycles. But it’s fair to assume (hope...) that the uniquely unfortunate set of circumstances we have experienced in 2022 are unlikely to recur.
Companies and markets are still adjusting to many shocks, including Brexit, Covid, a reverse in globalisation, war in Europe, galloping inflation and political uncertainty from polarised electorates in the US and Europe, including the UK.
Given the circumstances, it is not surprising that investor sentiment is at a low ebb and, consequently, discounts to
NAV across the entire investment trust sector have widened considerably. In some cases, this will have added insult to injury, given that many trust managers have been wrong-footed by events this year.
Very high valuations of growth stocks, together with a preponderance for growth versus value strategies in the trust sector, not to mention gearing and perhaps too much ‘home bias’ when sterling has been very weak, have all led to a disappointing period for many trusts, whatever their sector.
Every trust has its own very specific reasons for the level of discount but, in our view, it is not surprising that discounts have widened generally. ‘Risk-off’ sentiment has been a major driver, but are there any other broad characteristics that have contributed to discounts widening? Are there lessons to be learnt from this year’s miserable test case?
And if discounts have widened for particular subsets of trusts, perhaps these are the places to focus on for the rebound? If market conditions return somewhere towards the norm, it might be expected that these trusts will see their discounts narrow more than the rest, providing a useful accelerant to NAV returns.
Here, we consider a variety of ex-ante and ex-post factors
and screen the investment trust universe for trusts with these characteristics, comparing the experience of those at either end of the spectrum to see if we can gain any insight into the drivers
behind significant discount widening.
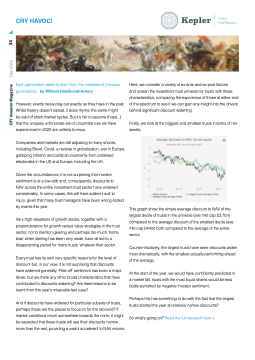
Firstly, we look at the biggest and smallest trusts in terms of net assets.
This graph show the simple average discount to NAV of the largest decile of trusts in the universe (ave mkt cap £3.7bn) compared to the average discount of the smallest decile (ave mkt cap £44m) both compared to the average of the entire sector.
Counter-intuitively, the largest trusts have seen discounts widen most dramatically, with the smallest actually performing ahead of the average.
At the start of the year, we would have confidently predicted in a market fall, trusts with the most liquid shares would be less badly punished by negative investor sentiment.
Perhaps this has something to do with the fact that the largest trusts started the year at relatively narrow discounts?
So what’s going on? Read the full research here >
CRY HAVOC!
