DIY Investor Magazine
/
March 2016
32
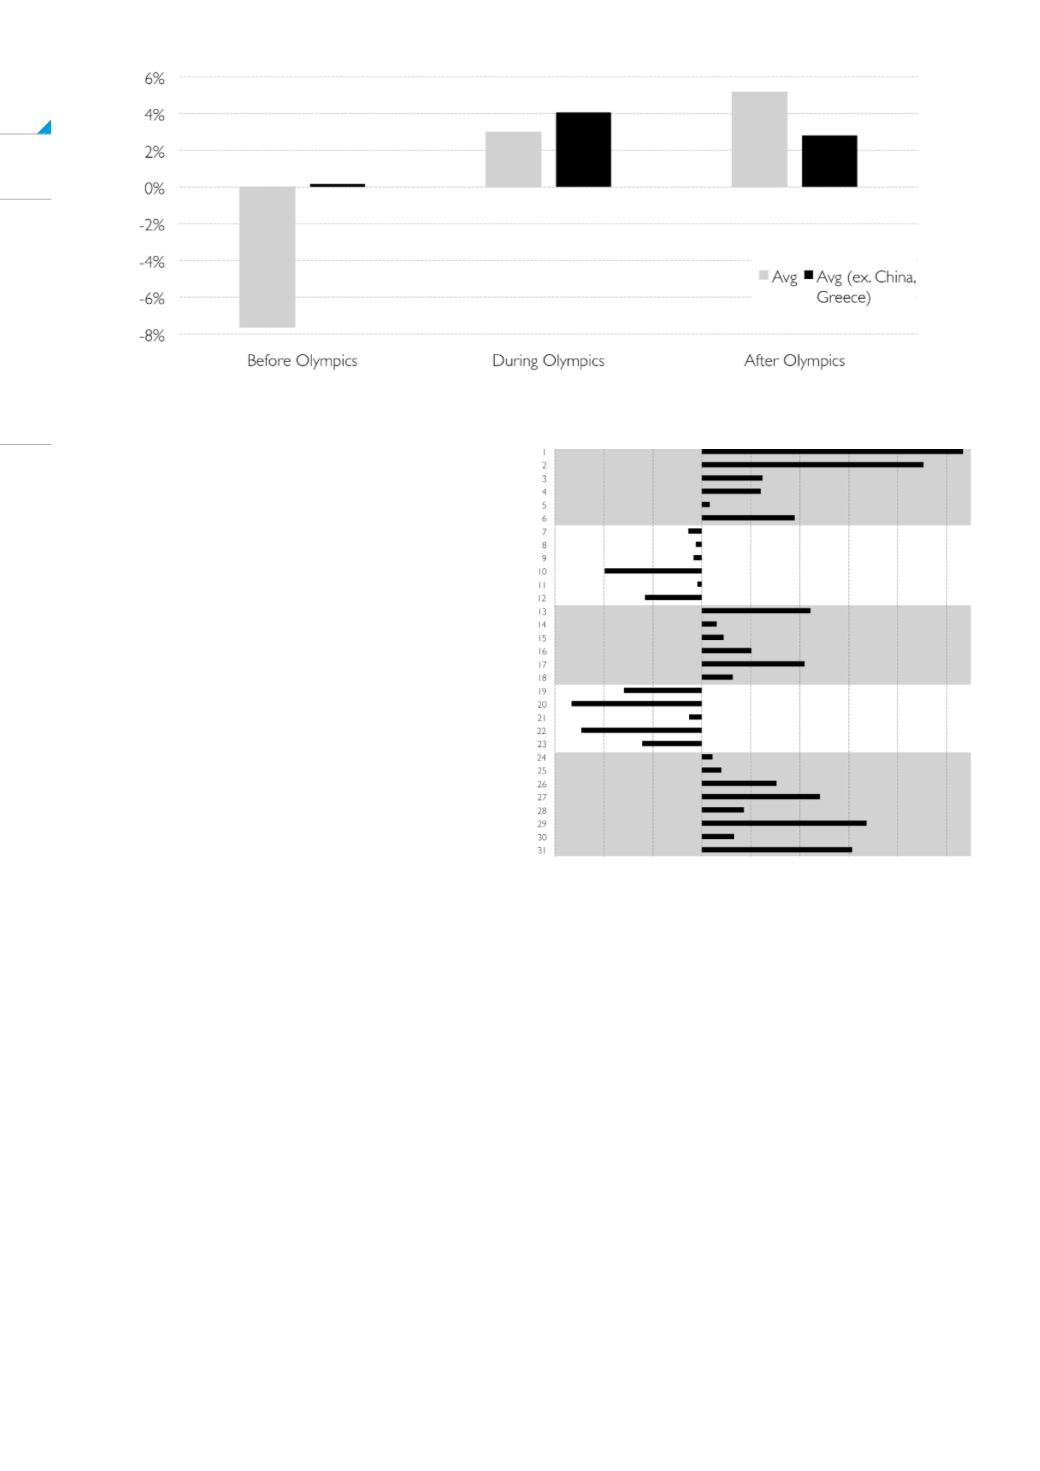
Generally, equities in host country markets appear to
be weak in the months leading up to the games,
perhaps when the media runs stories of cost overruns
and missed timetables. And then there appears to be a
relief rally afterwards.
DAYS OF THE MONTH
Last time we looked at the behaviour of the UK stock
market in an average month, here we look at the historic
behaviour of the market on each day of the month.
The following chart plots the average daily returns for
the 31 calendar days in a month for the FTSE 100 over
the period 1984-2015. For example, since 1984, the
FTSE 100 has on average increased 0.27% on the 1st
day of each month. Note, the chart plots the average
returns on the calendar days of the months rather than
just trading days.
Some observations:
1.
The first day of each month has the highest average daily return for the FTSE 100, followed closely by the
second day.
2.
The worst average daily return has been on the 20th of the month.
3.
As can be seen in the chart, the periods of strongest daily returns occur in first and final weeks of the month.
4.
The pattern of daily returns in months divides into five (rather surprisingly precise) phases:
•
Phase 1 (1st – 6th): the index sees positive daily returns
•
Phase 2 (7th – 12th): the index sees negative daily returns
•
Phase 3 (13th – 18th): the index sees positive daily returns
•
Phase 4 (19th – 23rd): the index sees negative daily returns
•
Phase 5 (24th – 31st): the index sees negative daily returns
NB. The chart above highlights the positive daily return phases of a month. This is a book that may have you
scratching your head in search of a rational explanation for what is presented,
but one thing is for sure, you’ll return to it again and again as 2016 unfolds. To purchase this book for the special
DIY Investor price of £18 + P&P (RRP £25) use the following promotional
code when checking out at the Harriman House online bookshop: DiYEE15.


