
Page 28 - DIY Investor Magazine - May 2019
P. 28
SELL IN MAY? STOCK MARKET ALMANAC - SEASONALITY EFFECTS AND ANOMALIES
Stephen Eckett’s fascinating reference work delivers an update on the strongest – and strangest – seasonality effect in the market
This month we delve further into this engaging and curious guide to the financial year and consider vital information for all investors and traders looking for the little edge that could make a big difference.
SELL IN MAY
An update on the strongest – and strangest – seasonality effect in the market.
It’s that time of the year again when stock market lore advises investors to get out of the market and, effectively, go on holiday for six months. Indeed, Sell in May has been good advice over certain periods, for example since 1970 the average return in May for the FTSE All- Share Index has been -0.4% (making it one of only three months that has a negative return ¬ the other two being June and September).
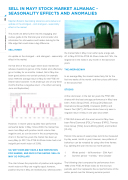
However, in recent years equities have performed somewhat better in May. Since 2000, the market has seen more Mays with positive month returns than negative and, as can be seen in the accompanying chart, in the last five years the market has been up every May (in 2017, the FTSE All-Share Index had a not insignificant month return of 3.9%).
SO, WHY DOES MAY HAVE A BAD REPUTATION FOR SHARES, AND WHY IS THE SAYING ‘SELL IN MAY’ SO POPULAR?
The chart shows the proportion of positive and negative month returns in May are roughly equal; however, positive returns in May are relatively low, whereas when
the market falls in May it can suffer quite a large sell- off. In May 2012 the FTSE All-Share Index fell 7.5%, the largest fall in the index in any month in the last seven years.
THE AVERAGE MAY
In an average May the market trades fairly flat for the first two weeks of the month, and then prices drift lower in the second half.
STOCKS
At the stock level, in the last ten years the FTSE 350 shares with the best average performance in May have been: Aveva Group [AVV], 3i Group [III], Babcock International Group [BAB], Cranswick [CWK], and Severn Trent [SVT]. All these stocks have only seen a negative return in May in one year since 2007.
FTSE 350 shares with the worst record in May have been Petra Diamonds [PDL], Ferrexpo [FXPO], Thomas Cook Group [TCG], Acacia Mining [ACA], and Carillion [CLLN],
Historic time series of asset prices tend to be measured by day, week, month or year; however, new patterns of behaviour can be revealed by using other time frames. E.g. splitting the year into two six month periods:
1. Winter period – 1st November – 30th April
2. Summer period – 1st May – 31st October
The following chart compares the performance from 1982 of the FTSE All-Share index for the next two periods; each bar represents the out performance of the winter period over the following summer period.
DIY Investor Magazine | May 2019 28
