DIY Investor Magazine
| Oct 2017
42
OCTOBER MARKET SEASONALITY EFFECTS AND ANOMALIES
The latest edition of Stephen Eckett’s fascinating
reference book may have you scratching your
head in search of a rational explanation for what
is presented, but one thing is for sure, you’ll
return to it again and again as 2017 unfolds.
The UK Stockmarket Almanac
Market performance this month
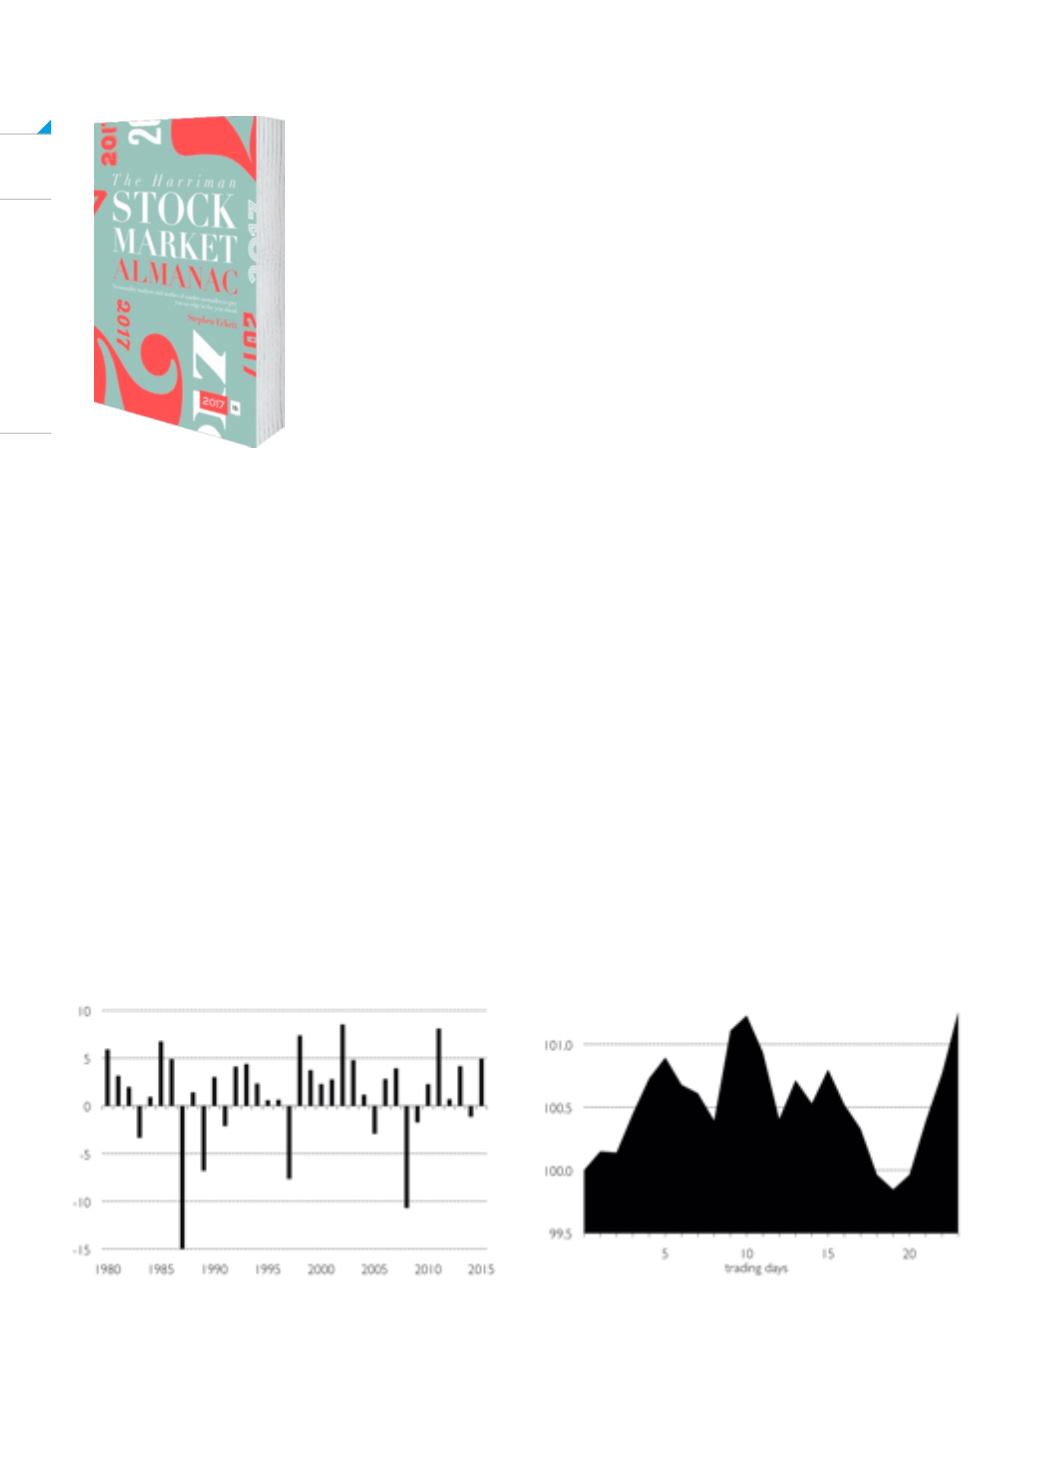
October can be a volatile month for equities. Since
1984, seven of the ten largest one-day falls in the market
have occurred in October. The largest fall occurred on
20 October 1987 when the FTSE 100 fell 12.2%. So, this
would appear to bode ill for investors in October.
However, if you look at the accompanying chart you will
see why averages don’t tell the whole story and how
things have changed in recent years.
For example, since 1992 the market has only fallen
in five years (and two of those of years were the
exceptional years of 2008 and 2009).
And since 2000, the average stock market return for
month has been 1.7%, making it the second best month
for equities after April in that period.
The strength of equities in October may not be
unconnected with the fact that the strong six-month
period of the year starts at the end of October (part of
the Sell in May effect) and investors may be anticipating
this by increasing their weighting in equities during
October. But while October, therefore, should be
regarded as a good month for shares, any occasional
weakness in the month can be severe.
In an average month for October, the market tends to
rise in the first two weeks then fall back, before a surge
in prices in the last few days of the month (Sell in May
Effect – aka Halloween Effect – again!)


