DIY Investor Magazine
| August 2017
22
SEPTEMBER MARKET SEASONALITY EFFECTS & ANOMALIES
The latest edition of Stephen Eckett’s fascinating
reference book may have you scratching your
head in search of a rational explanation for what
is presented, but one thing is for sure, you’ll
return to it again and again as 2017 unfolds.
The UK Stockmarket Almanac
Market performance this month
After summer the stock market tends to burst back into
life in September. Unfortunately, the renewed activity in
shares tends to be on the downside. Since 1984, the
FTSE 100 has an average return of -1.1% in this month,
which gives September the worst record for shares of
any month in the year. And things haven’t improved
recently – since year 2000 the average return in
September has been -1.9%.
The Psychology of Drawdowns
September has a reputation for market volatility, so let’s
look at losses.
How do investors measure unrealised losses? One way,
of course, is to compare the current price with the price
paid for an investment. So, for example, if you pay 100
for an investment and its current market price is 90, then
you are sitting on a (unrealised) loss of 10%.
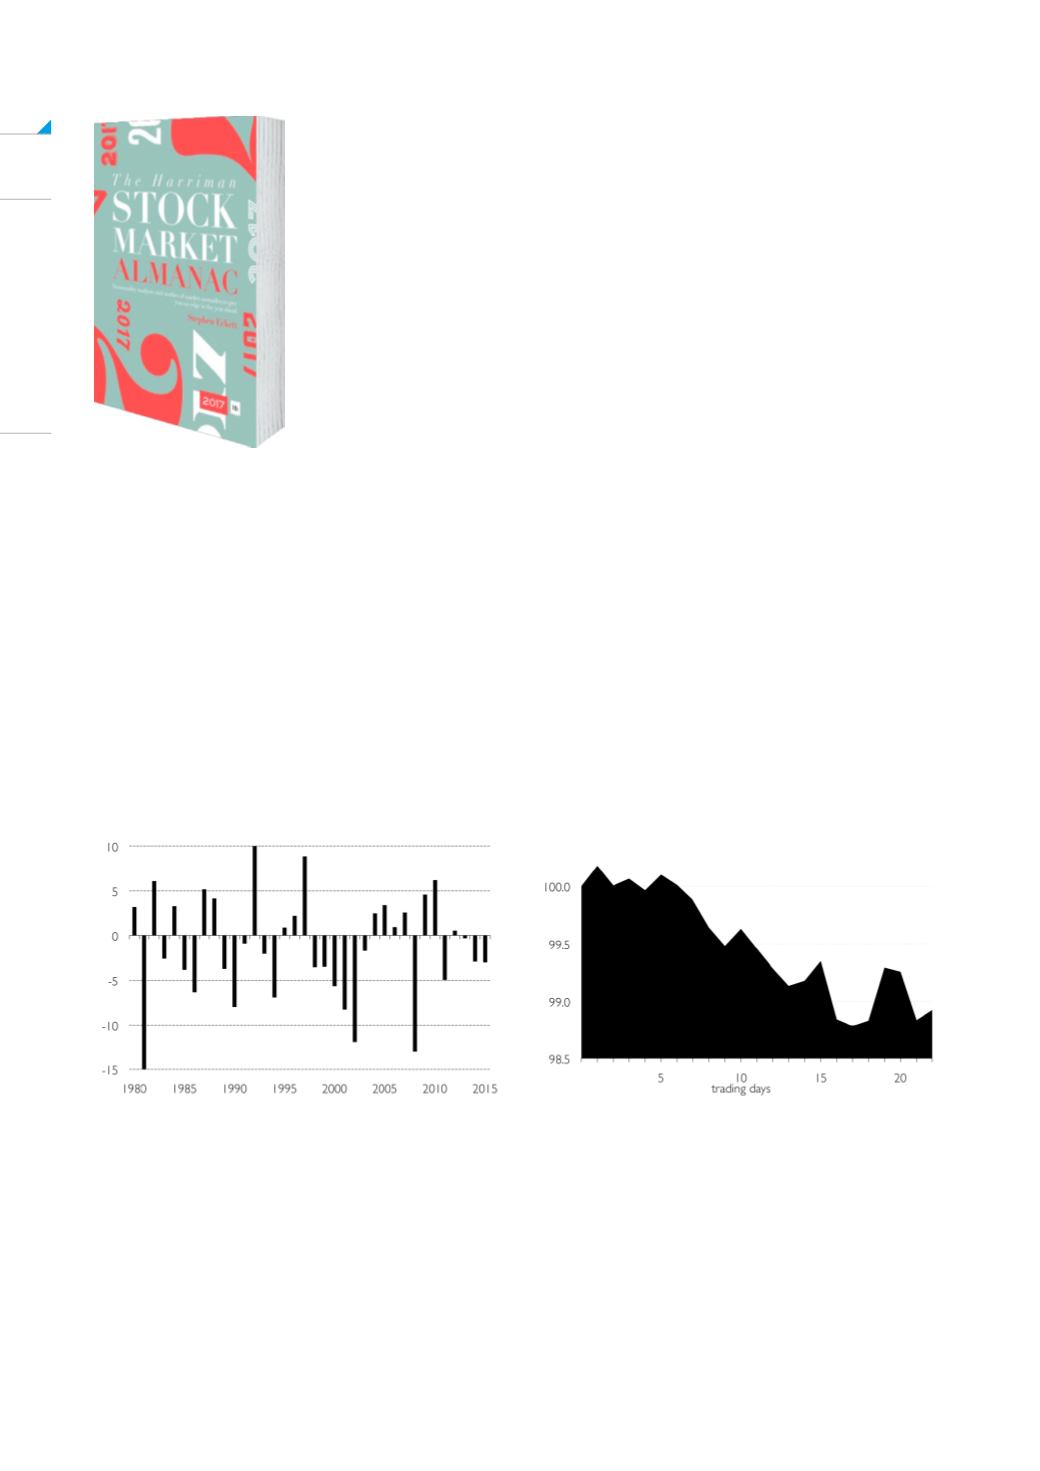
However, although the average return is bad for the
month, about half of all Septembers actually have
positive returns. The problem is that when the market
does fall in this month, the falls can be very large. For
example, as can be seen in the accompanying chart,
the market has fallen over 8% in three years since 2000.
In an average month for September, the market tends
to gently drift lower for the first three weeks before
rebounding slightly in the final week – although the final
trading day (FTD) of the month has historically been one
of the weakest FTDs of all months in the year.
But if, after buying the investment at 100, the price had
risen to 120 before then falling back to 90, then there is
the temptation to anchor the price at 120 and regard the
current price of 90 as a 25% loss.
This 25% loss is referred to as the drawdown, which is
defined as the percentage loss from a previous peak.
The concept is common in trading but can also be
useful for investors.


